Custom Columns for Flexible Apple Search Ads Optimization
 Anastasia Sidoryk
  Anastasia Sidoryk
 The SearchAdsHQ team is excited to announce that our platform for Apple Search Ads optimization and management has been supercharged with custom columns.
We’ve seen multiple cases where Apple Search Ads managers needed metrics beyond those already included in the SearchAdsHQ platform. Or they needed to calculate vital metrics in a manner that differs from ours. Custom columns have been designed to fix all those issues.
With the new feature, you can save your own formulas as custom columns to be able to:
From the available metrics, numbers and operators, you can make up a wide range of formulas and save them as custom columns on the dashboard.
Below, we’ve described the most popular cases of using this SearchAdsHQ functionality. Needless to say, you can have totally different approaches to calculating the metrics from the examples.
Let’s say you want to optimize Apple Search Ads for ROAS. By default, SearchAdsHQ gauges ROAS using the following formula:
ROAS = Revenue / Spend * 100%
This ROAS is displayed on the dashboard.
However, you know that you’ve got reporting discrepancies and the ROAS calculated with the formula above doesn’t account for Limit Ad Tracking (LAT).
To gauge custom ROAS adjusted for the LAT On traffic, use the following formula:
Custom ROAS = (Revenue + (Revenue / LAT Off Downloads Share – Revenue) * Q) / Spend
Q is the decreasing coefficient that helps take into account the converting quality of LAT On users – they may get converted worse compared to LAT Off users. And the worse you think they get converted, the lower Q coefficient you should choose.
Q is ranged from 0.5 to 1.0, but we recommend using Q = 0.9.
LAT Off Downloads Share is the percentage of the total downloads number represented by LAT Off users.
n fact, there are different ways to calculate ROAS with adjustments, but let’s go with the formula above.
All the settings in SearchAdsHQ will have to be performed from the popup window below:
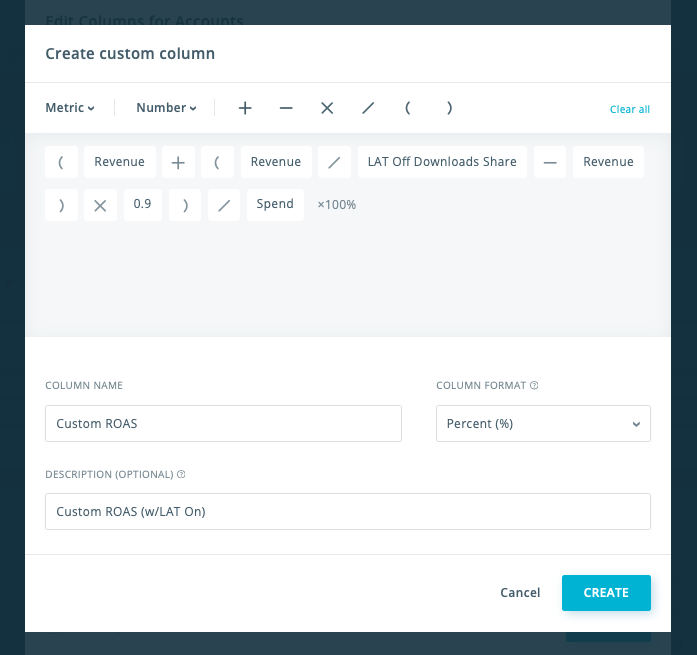
To create the “Custom ROAS” column, insert all the formula components in the upper menu using the metrics, operators and a number – 0.9 (for the recommended Q coefficient).
Then, give the column a unique name, add a description and set “Percent” as the format.
Note! Don’t include “… x 100%” in the very formula. Set percent (%) as the column format and it will be added automatically.
And just like that, you set up a “Custom ROAS” column for quick access to the metric you use as well as for better optimization.
The same way you did for ROAS, you can build a custom column to get Cost-per-Goal (CPG) corrected for Limit Ad Tracking and have it readily available on the dashboard for Apple Search Ads optimization purposes.
On the SearchAdsHQ dashboard, you can find Cost-per-Goal gauged this way:
CPG = Spend / Goals
However, this calculation doesn’t imply the LAT On traffic. Again, you can get your true Cost-per-Goal using different approaches, and here’s one of the possible formulas:
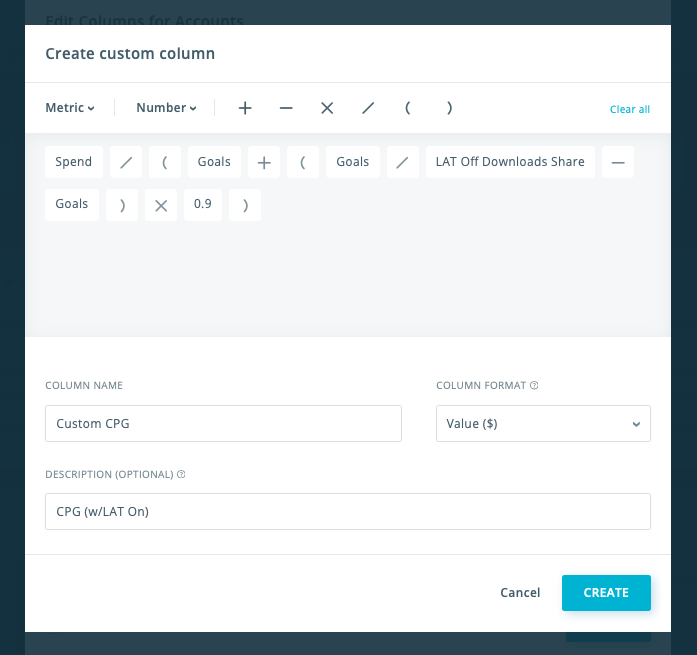
Custom CPG = Spend / (Goals + (Goals / LAT Off Downloads Share – Goals) * Q)
Q [0.5 to 1.0] is the decreasing coefficient that accounts for the converting quality of LAT On users. Set a lower value for Q if you assume your LAT On users may get converted worse than LAT Off users. The recommended Q = 0.9.
Goals in the formula are those generated by LAT Off users. This data can be found in the SearchAdsHQ dashboard, along with LAT Off Downloads Share – the percentage of the total downloads number represented by LAT Off users.
To receive Custom CPG corrected for LAT On discrepancies, configure the formula above as a custom column in SearchAdsHQ. The configuration popup will look as follows:
Сonversion rate estimates how your funnel works and whether it requires optimization. However, the way you calculate the conversion rate largely depends on what you define as your conversion event and on your funnel in general.
Currently, SearchAdsHQ tracks and displays the following conversions:
But for your optimization purposes, you may need conversion statistics beyond those that we offer. For example, you’d like to understand your conversion from impressions to installs, so you need to add in the following formula:
Conversion Rate = Installs/ Impressions
In the SearchAdsHQ platform, the settings will look the following way:
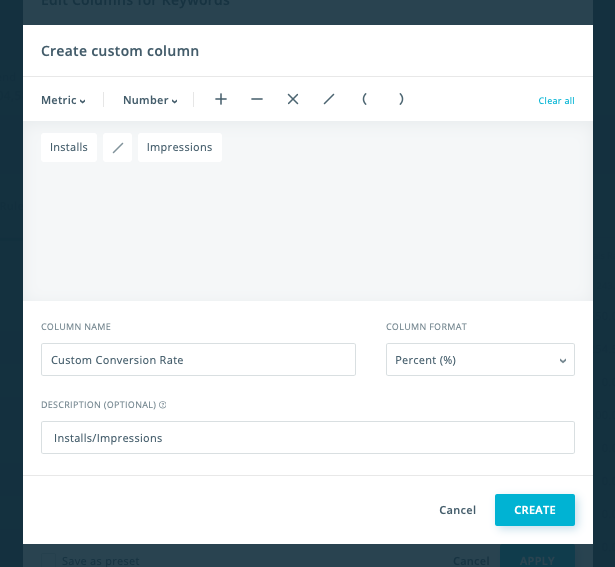
Again, make sure that you name the column in a unique way, and don’t include 100% as a multiplier while setting percent as the column format.
Depending on the kind of conversion you track, here are other possible formulas to receive custom conversion rates in SearchAdsHQ:
Conversion Rate = Downloads / Impressions
Conversion Rate = Installs / Taps
Conversion Rate = Goals / Taps
Conversion Rate = All Conversions / Taps
Custom columns can be created from and be applied to any dashboard level, except for search terms and negative keywords. Below is the workflow to make proper settings:
Step 1. Start with clicking on the “Edit Columns” button:

Step 2. Choose “Add Custom Column”:

Step 3. Choose “+New Custom Column”:
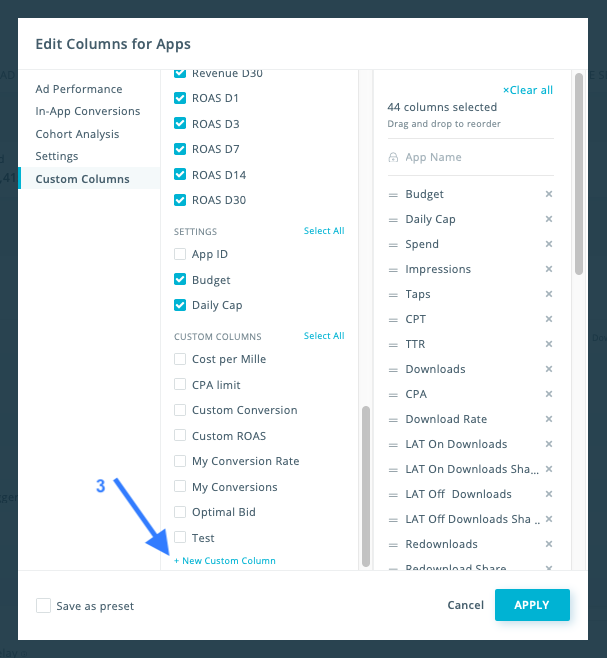
Step 4. You’ll see the “Create custom column” popup:
Here, you have to configure the following:
1) the formula itself by using metrics, numbers and operators from the upper menu.
Ad performance and in-app conversion metrics can be selected from the available options in the dropdown menu. By clicking on the “Number”, you’ll see the field to insert the value you want. To add an operator into the formula, simply click on it.
2) the name of the custom column. Make sure you don’t assign one name to different columns, so that you can easily differentiate between them on the dashboard.
3) the column format – value ($), percent (%) or number (1, 2, 3), depending on the metric type. For example, set percent for a custom ROAS column or value for custom Cost per Goal.
Note! Don’t include “… * 100%” in the formula if you set percent (%) as the column format, it is added automatically.
4) the column description, so that you can understand what the column is about after you’ve added it to the system. The description will be displayed on the dashboard in the tooltip associated with the respective custom column.
Step 5. Click “Create”.
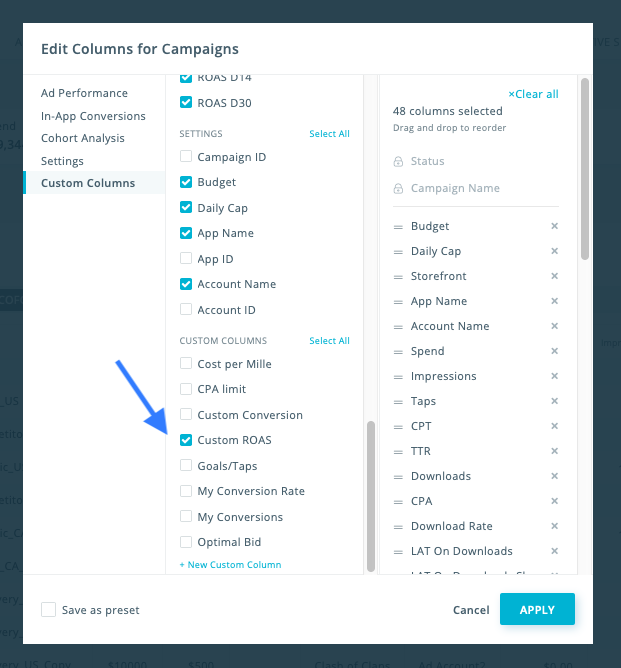
The configured custom column will appear in the list of existing columns. If you want to change its position on the dashboard, use the right menu where you can reorder columns by dragging and dropping.
Step 6. Choose “Apply” to add the column to the dashboard.

We’ve described the use cases above only to name a few. In fact, there are many more formulas that you might need and can set up through our platform. Custom columns are a step towards customized Apple Search Ads optimization, tailored to the individual needs of your business.
Want to try? Request a free SearchAdsHQ demo and we will show you how to use custom columns and other platform features to run profitable Apple Search Ads campaigns.