2019 Apple Search Ads Benchmarks by 13 Storefronts
 Anastasia Sidoryk
  Anastasia Sidoryk
 Around 70% of App Store visitors use search to find apps which, according to Apple, provokes 65% of all app installs. Together with the average Conversion Rate of 50%, such statistics argue for the fact: there’s no better place for your app to hit than App Store ads.
Publishers running Apple Search Ads used to have access to 13 locations. But Apple’s advertising network has recently expanded its coverage, now present in 59 countries and regions. After the release on March 27, you can target users in Africa, the Middle East, and India as well as Latin America and the Caribbean.
It’s hardly possible to assess the performance of campaigns in new Apple Search Ads storefronts because a bit more time is needed for the data to accumulate. However, if you are interested in the industry averages for the 13 storefronts, you’ve just found them.
The Apple Search Ads benchmarks report is based on a wide data sample that SearchAdsHQ team obtained from July 2018 to February 2019:
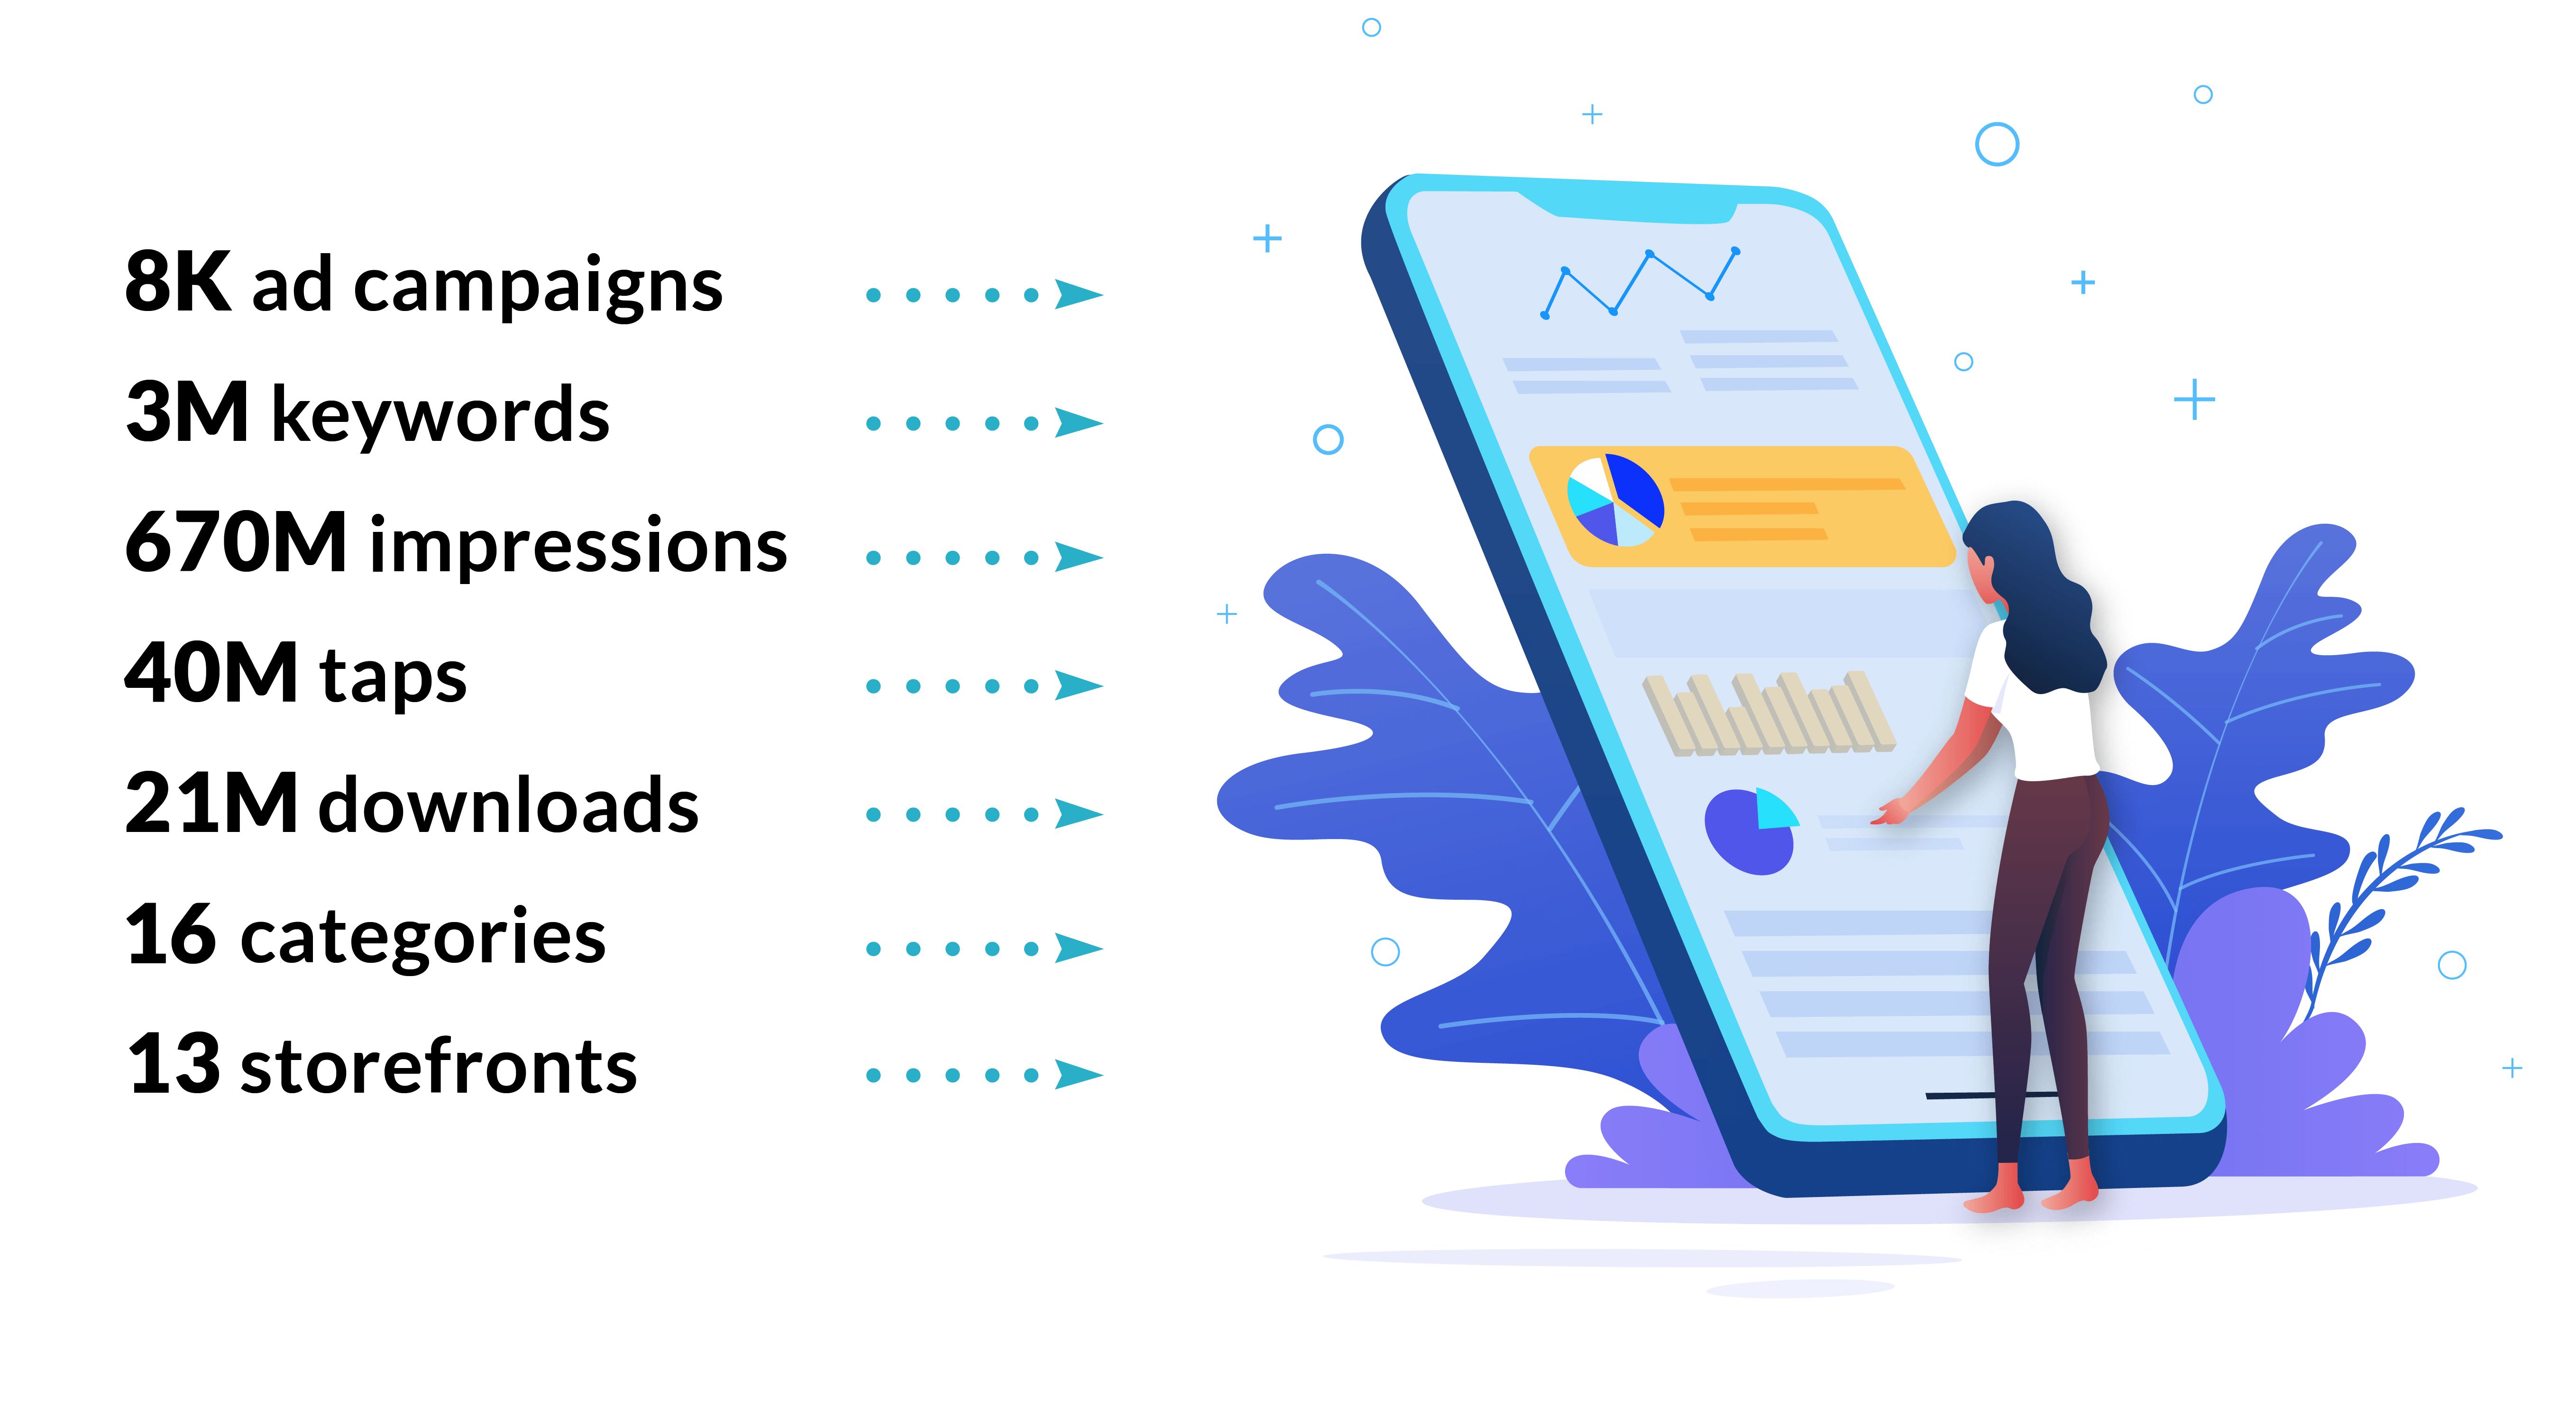
In this article, you will find the recent Tap-through and Conversion Rates, as well as average Cost per Tap and Cost per Acquisition across 13 Apple Search Ads storefronts: Australia, Canada, France, Germany, Italy, Japan, Mexico, New Zealand, South Korea, Spain, Switzerland; the United Kingdom and the United States.
For the most recent averages, as well as cost seasonality trends and an Interactive Dashboard, get Apple Search Ads Benchmarks Report Q2-Q4 2020.
Before you delve into the report, here are our findings in short:
Let’s start with the conversion from impressions to taps. With the average Apple Search Ads TTR at around 6.06%, higher rates are observed for Germany, the US, and Canada:
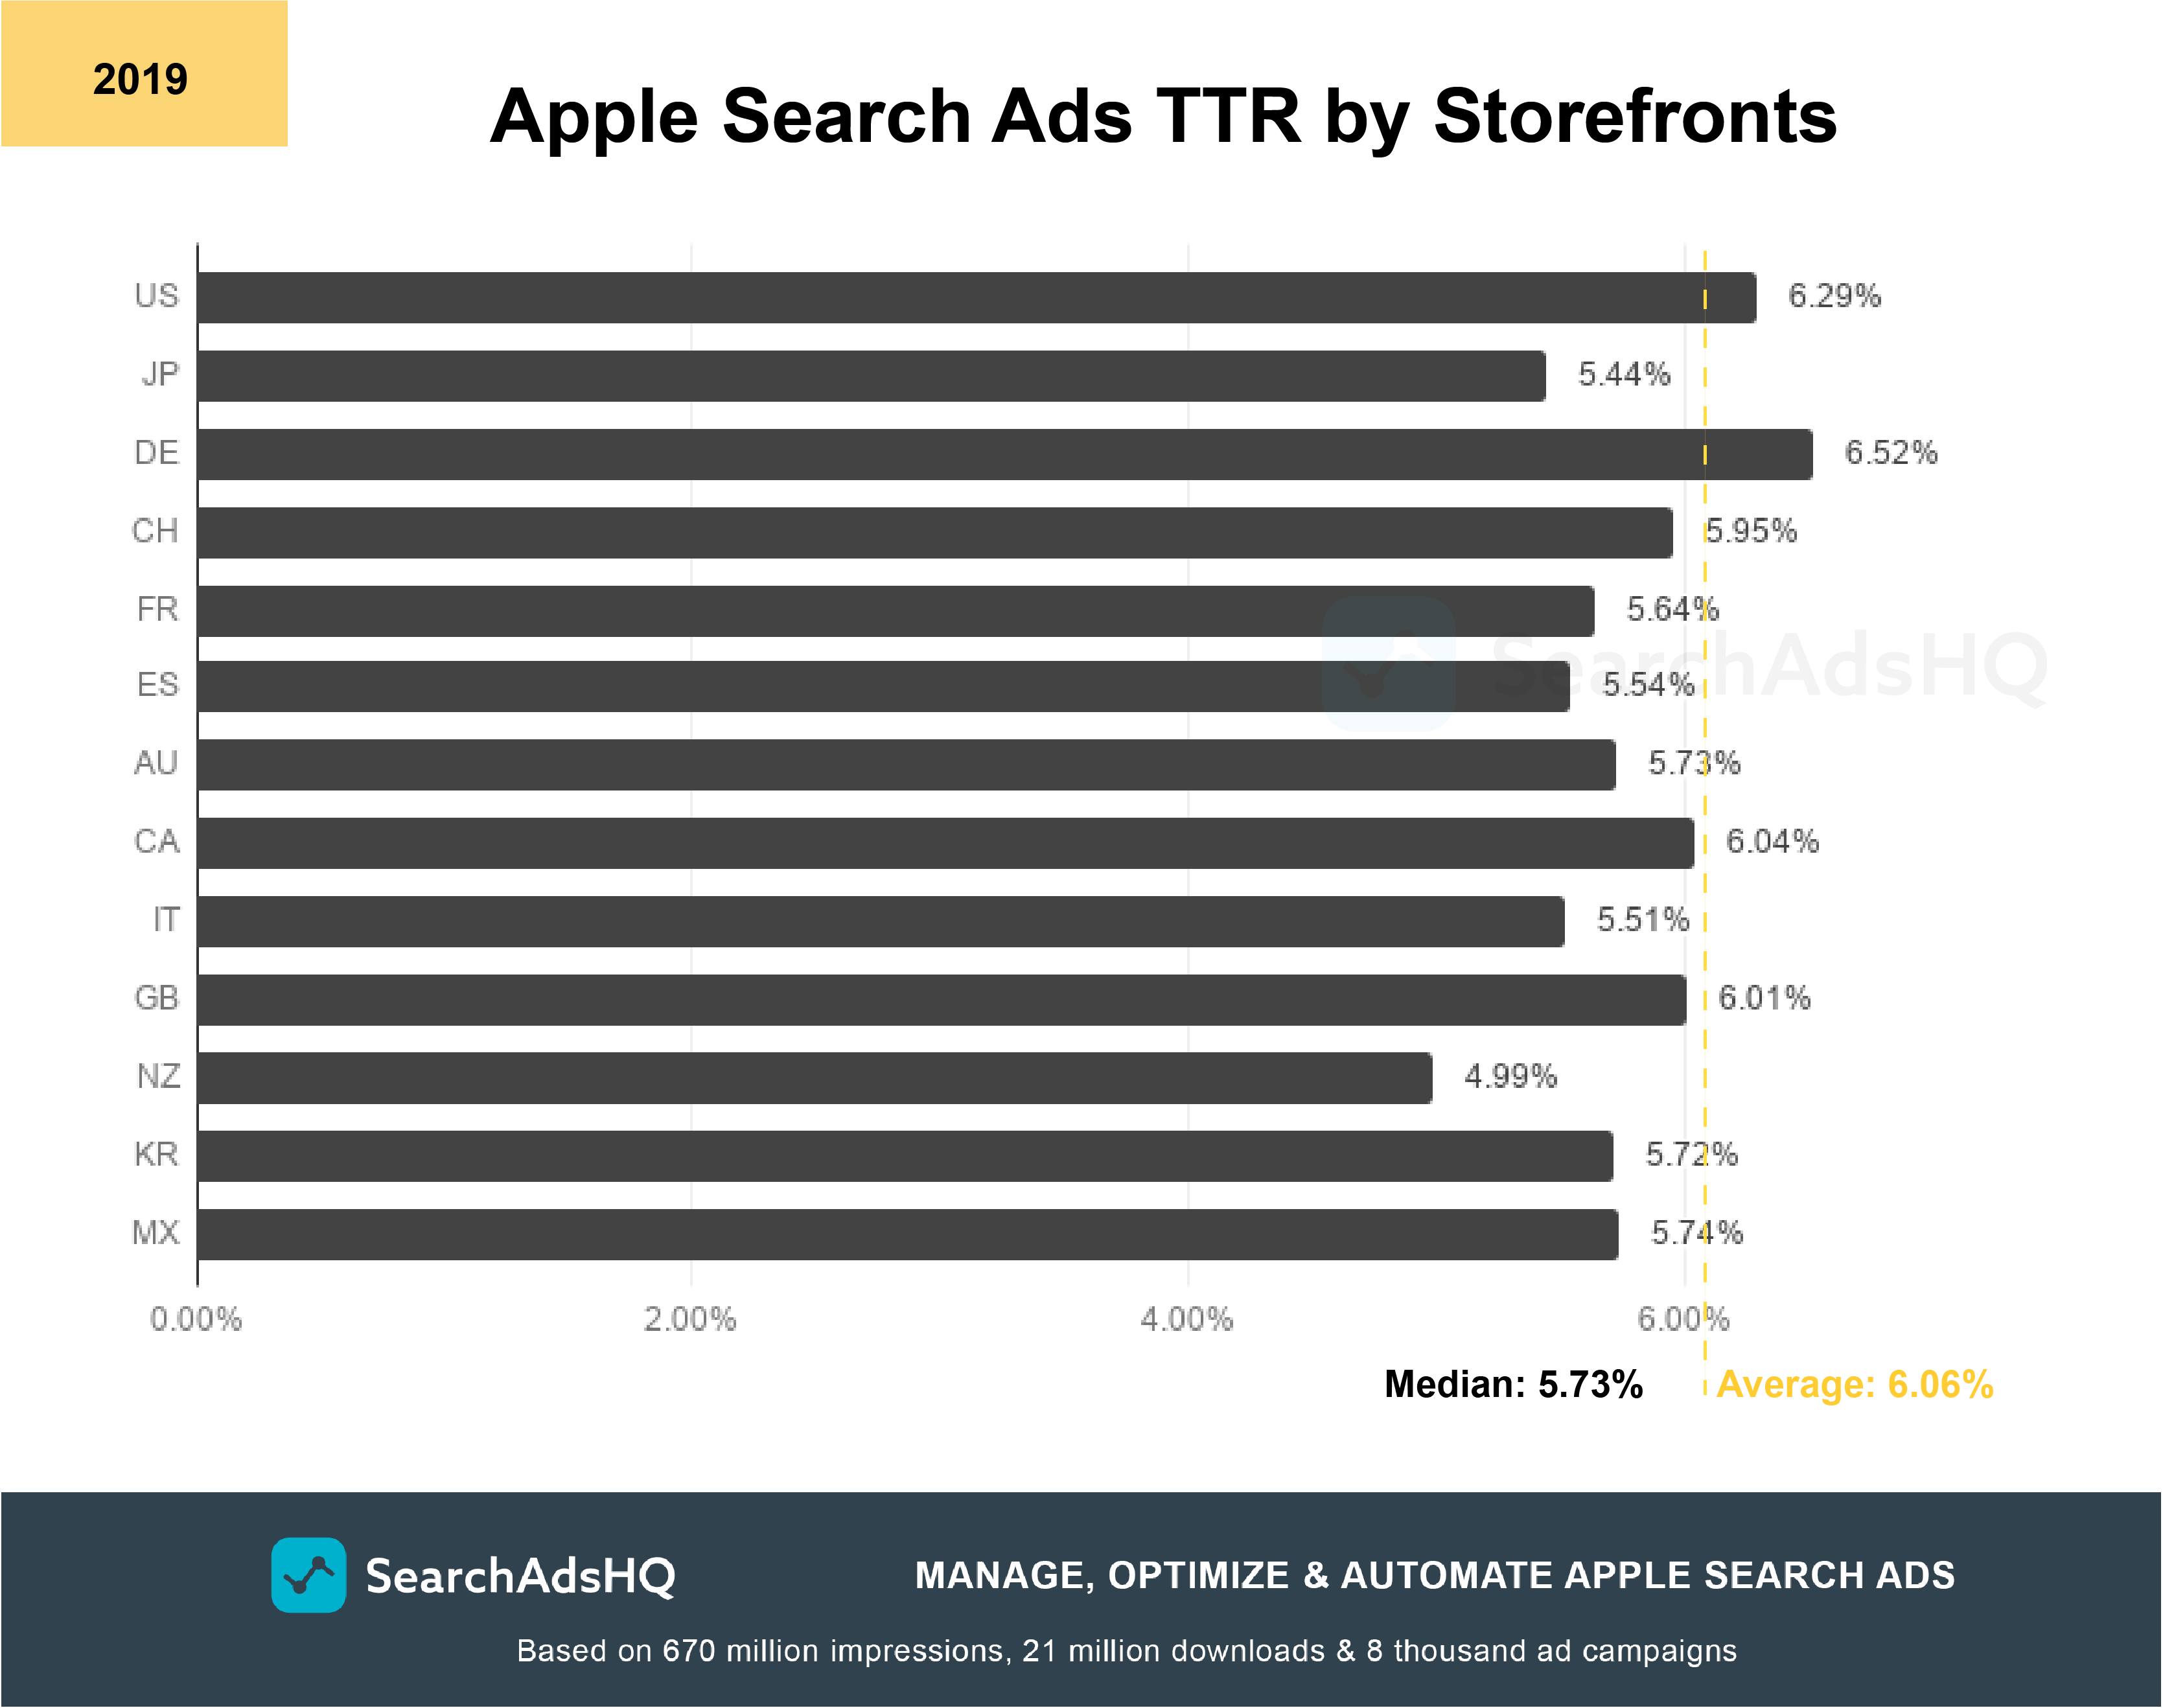
Overall, Tap-through rates are not that scattered, ranging from 4.99% in New Zealand to 6.52% in Germany.
Low TTRs in Asian storefronts can be attributed to cultural and language peculiarities. In the Japanese storefront, there’s a 5.44% TTR; in South Korea, it’s 5.72%. Asian markets are hard to enter for western companies. Breaking into them means that they have to considerably rethink app positioning towards peculiarities of a specific region.
However, we can see the same low impression-to-tap conversions for Italy, Spain and France. It is likely that publishers used English keywords and poorly localized campaigns for these Apple Search Ads storefronts.
Such a low TTR in the New Zealand storefront can be attributed to our data sample and a relatively limited number of campaigns run for the storefront.
When it comes to Conversion from taps to downloads (CVR), the range is much wider: with the average at 49.69%, CVR ranges between 33.22% (Japan) and 54.89% (the UK):
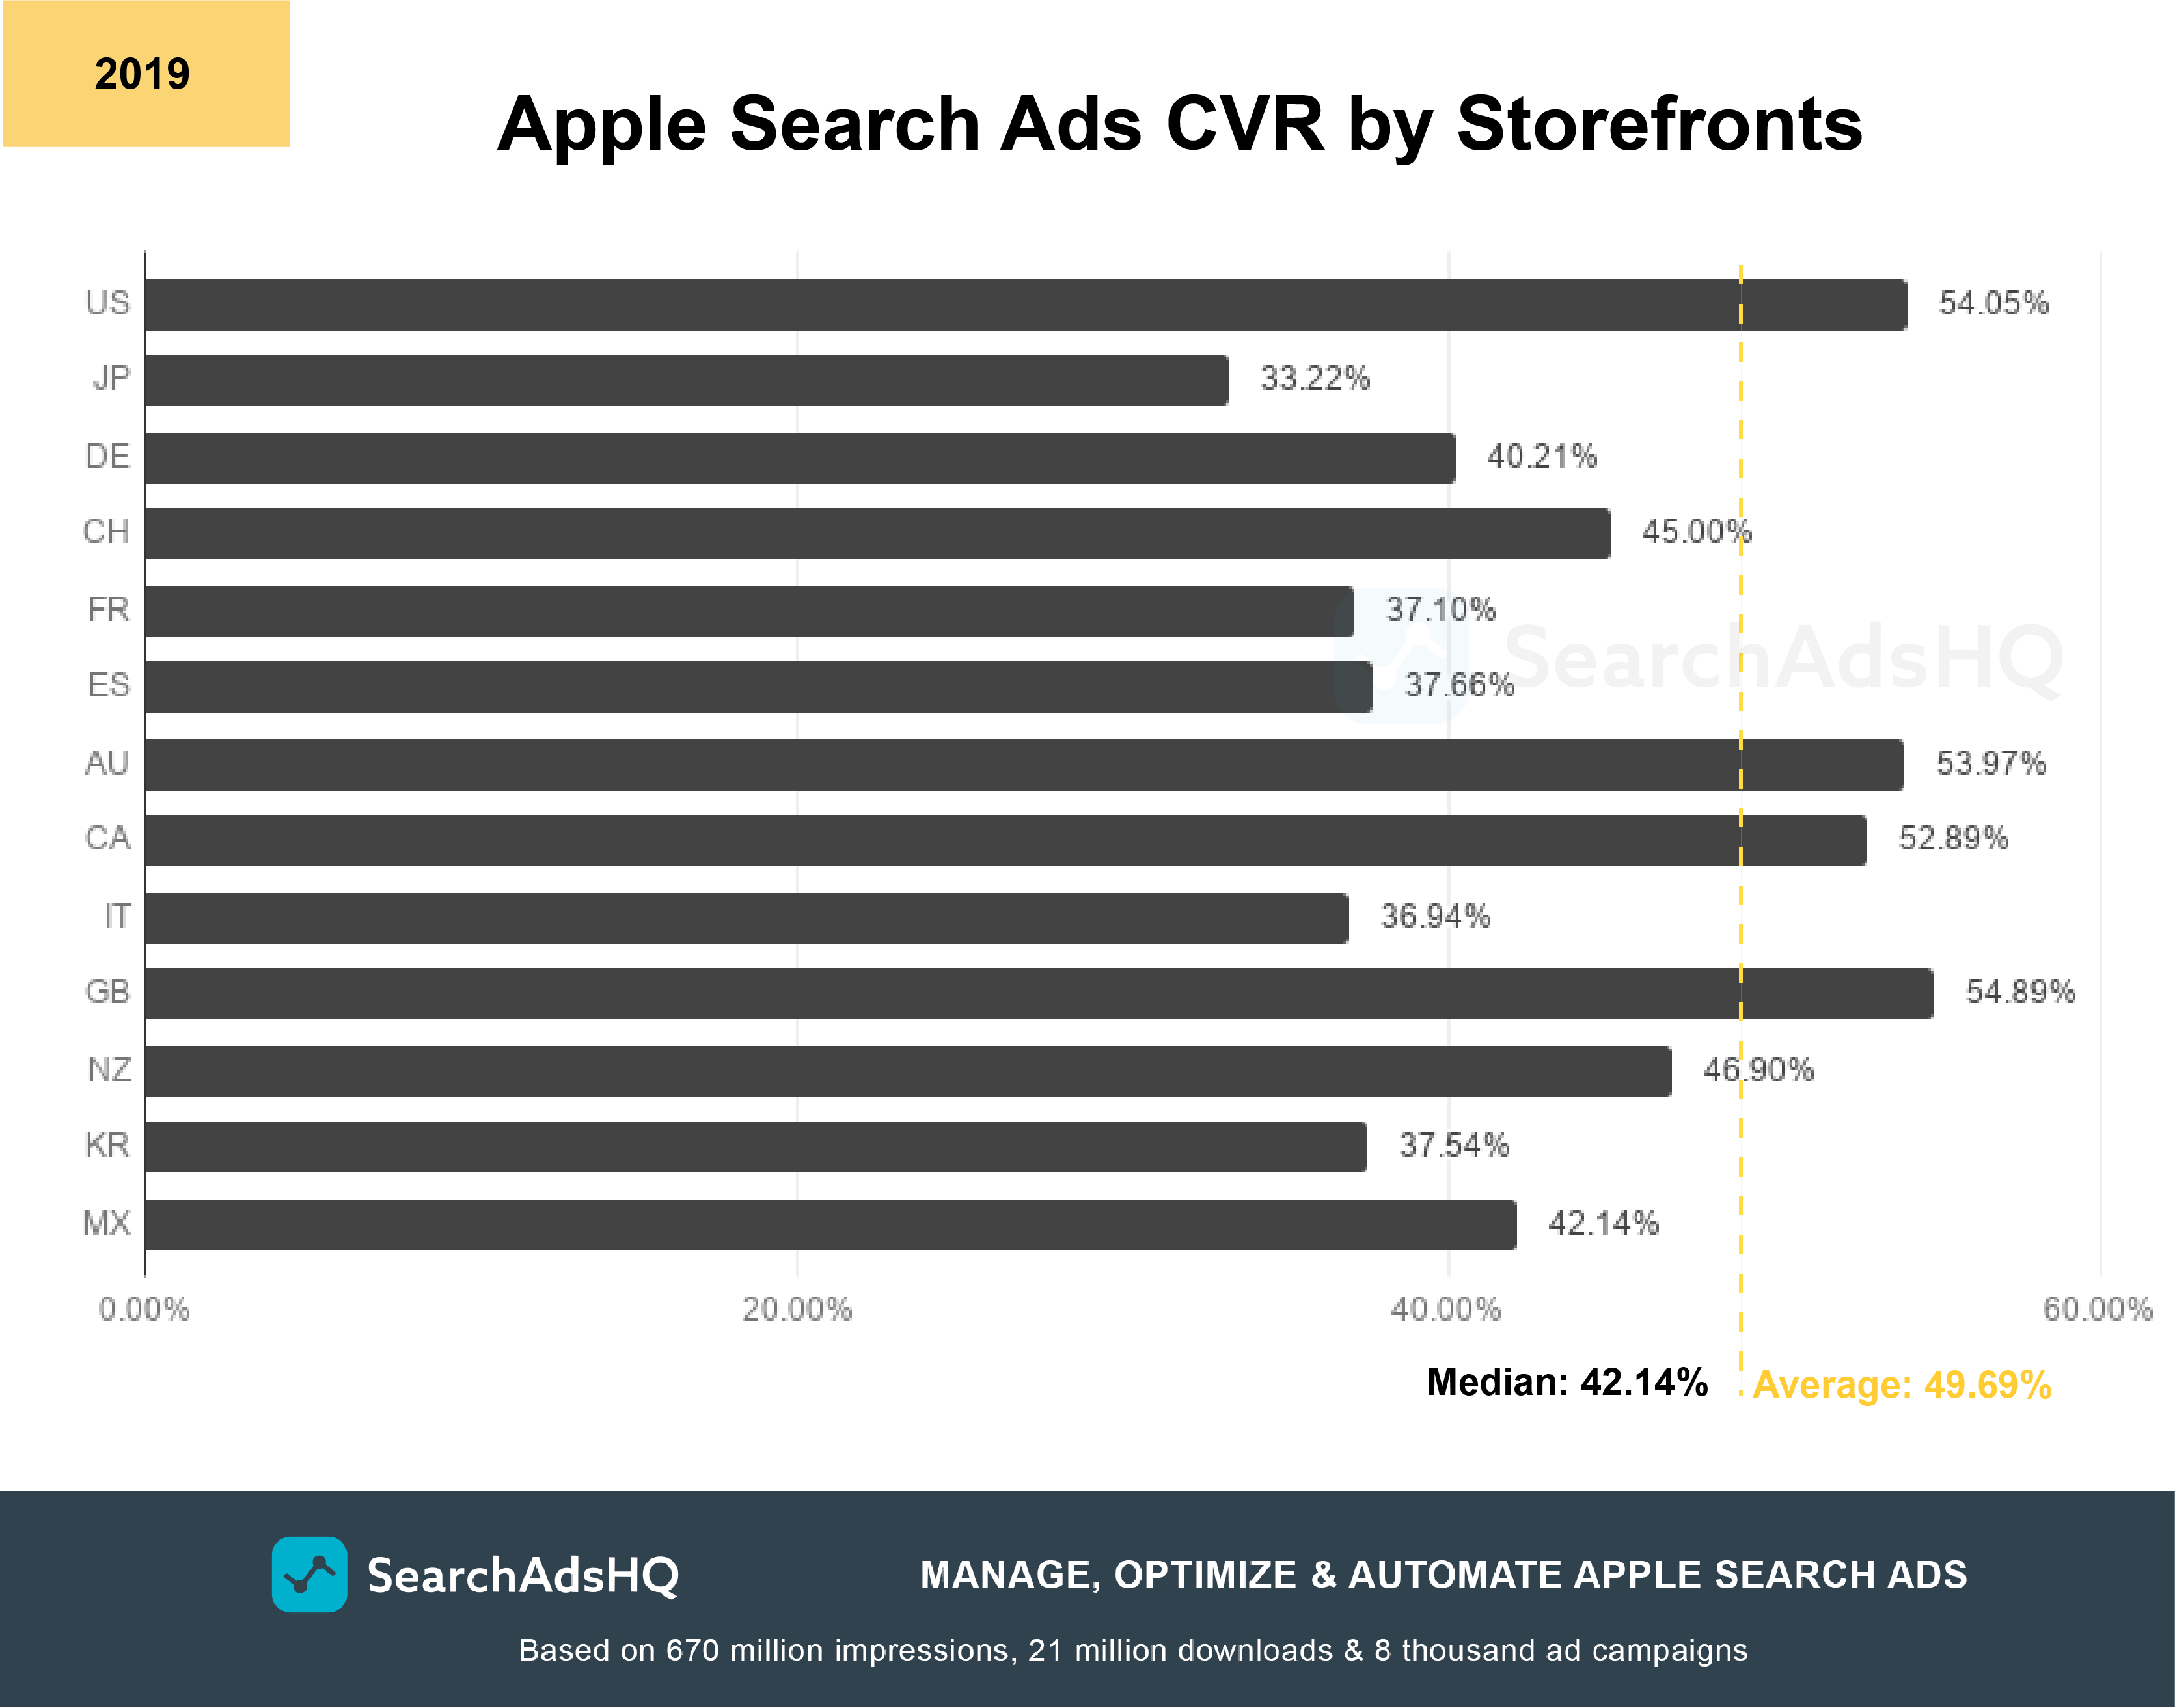
Compare the data with the TTR chart above: obviously, high TTR doesn’t always turn into high CVR. For example, while Tap-through rate in the German storefront was the highest of all, its Conversion rate is below the average. And conversely, New Zealand was at the bottom of the TTR chart, but CVR in this storefront was quite high.
Such a situation suggests that taps don’t necessarily lead to an app install. The product page has to be A/B tested and optimized to encourage users to tap “Get”.
Overall, we can observe a higher conversion rate for English-speaking locations, while the two Asian storefronts – Japan and South Korea, as well as Spain, France and Italy lag behind. Again, it is likely to result from poor localization of metadata elements, as well as the usage of keywords that haven’t been properly localized for a particular Apple Search Ads storefront.
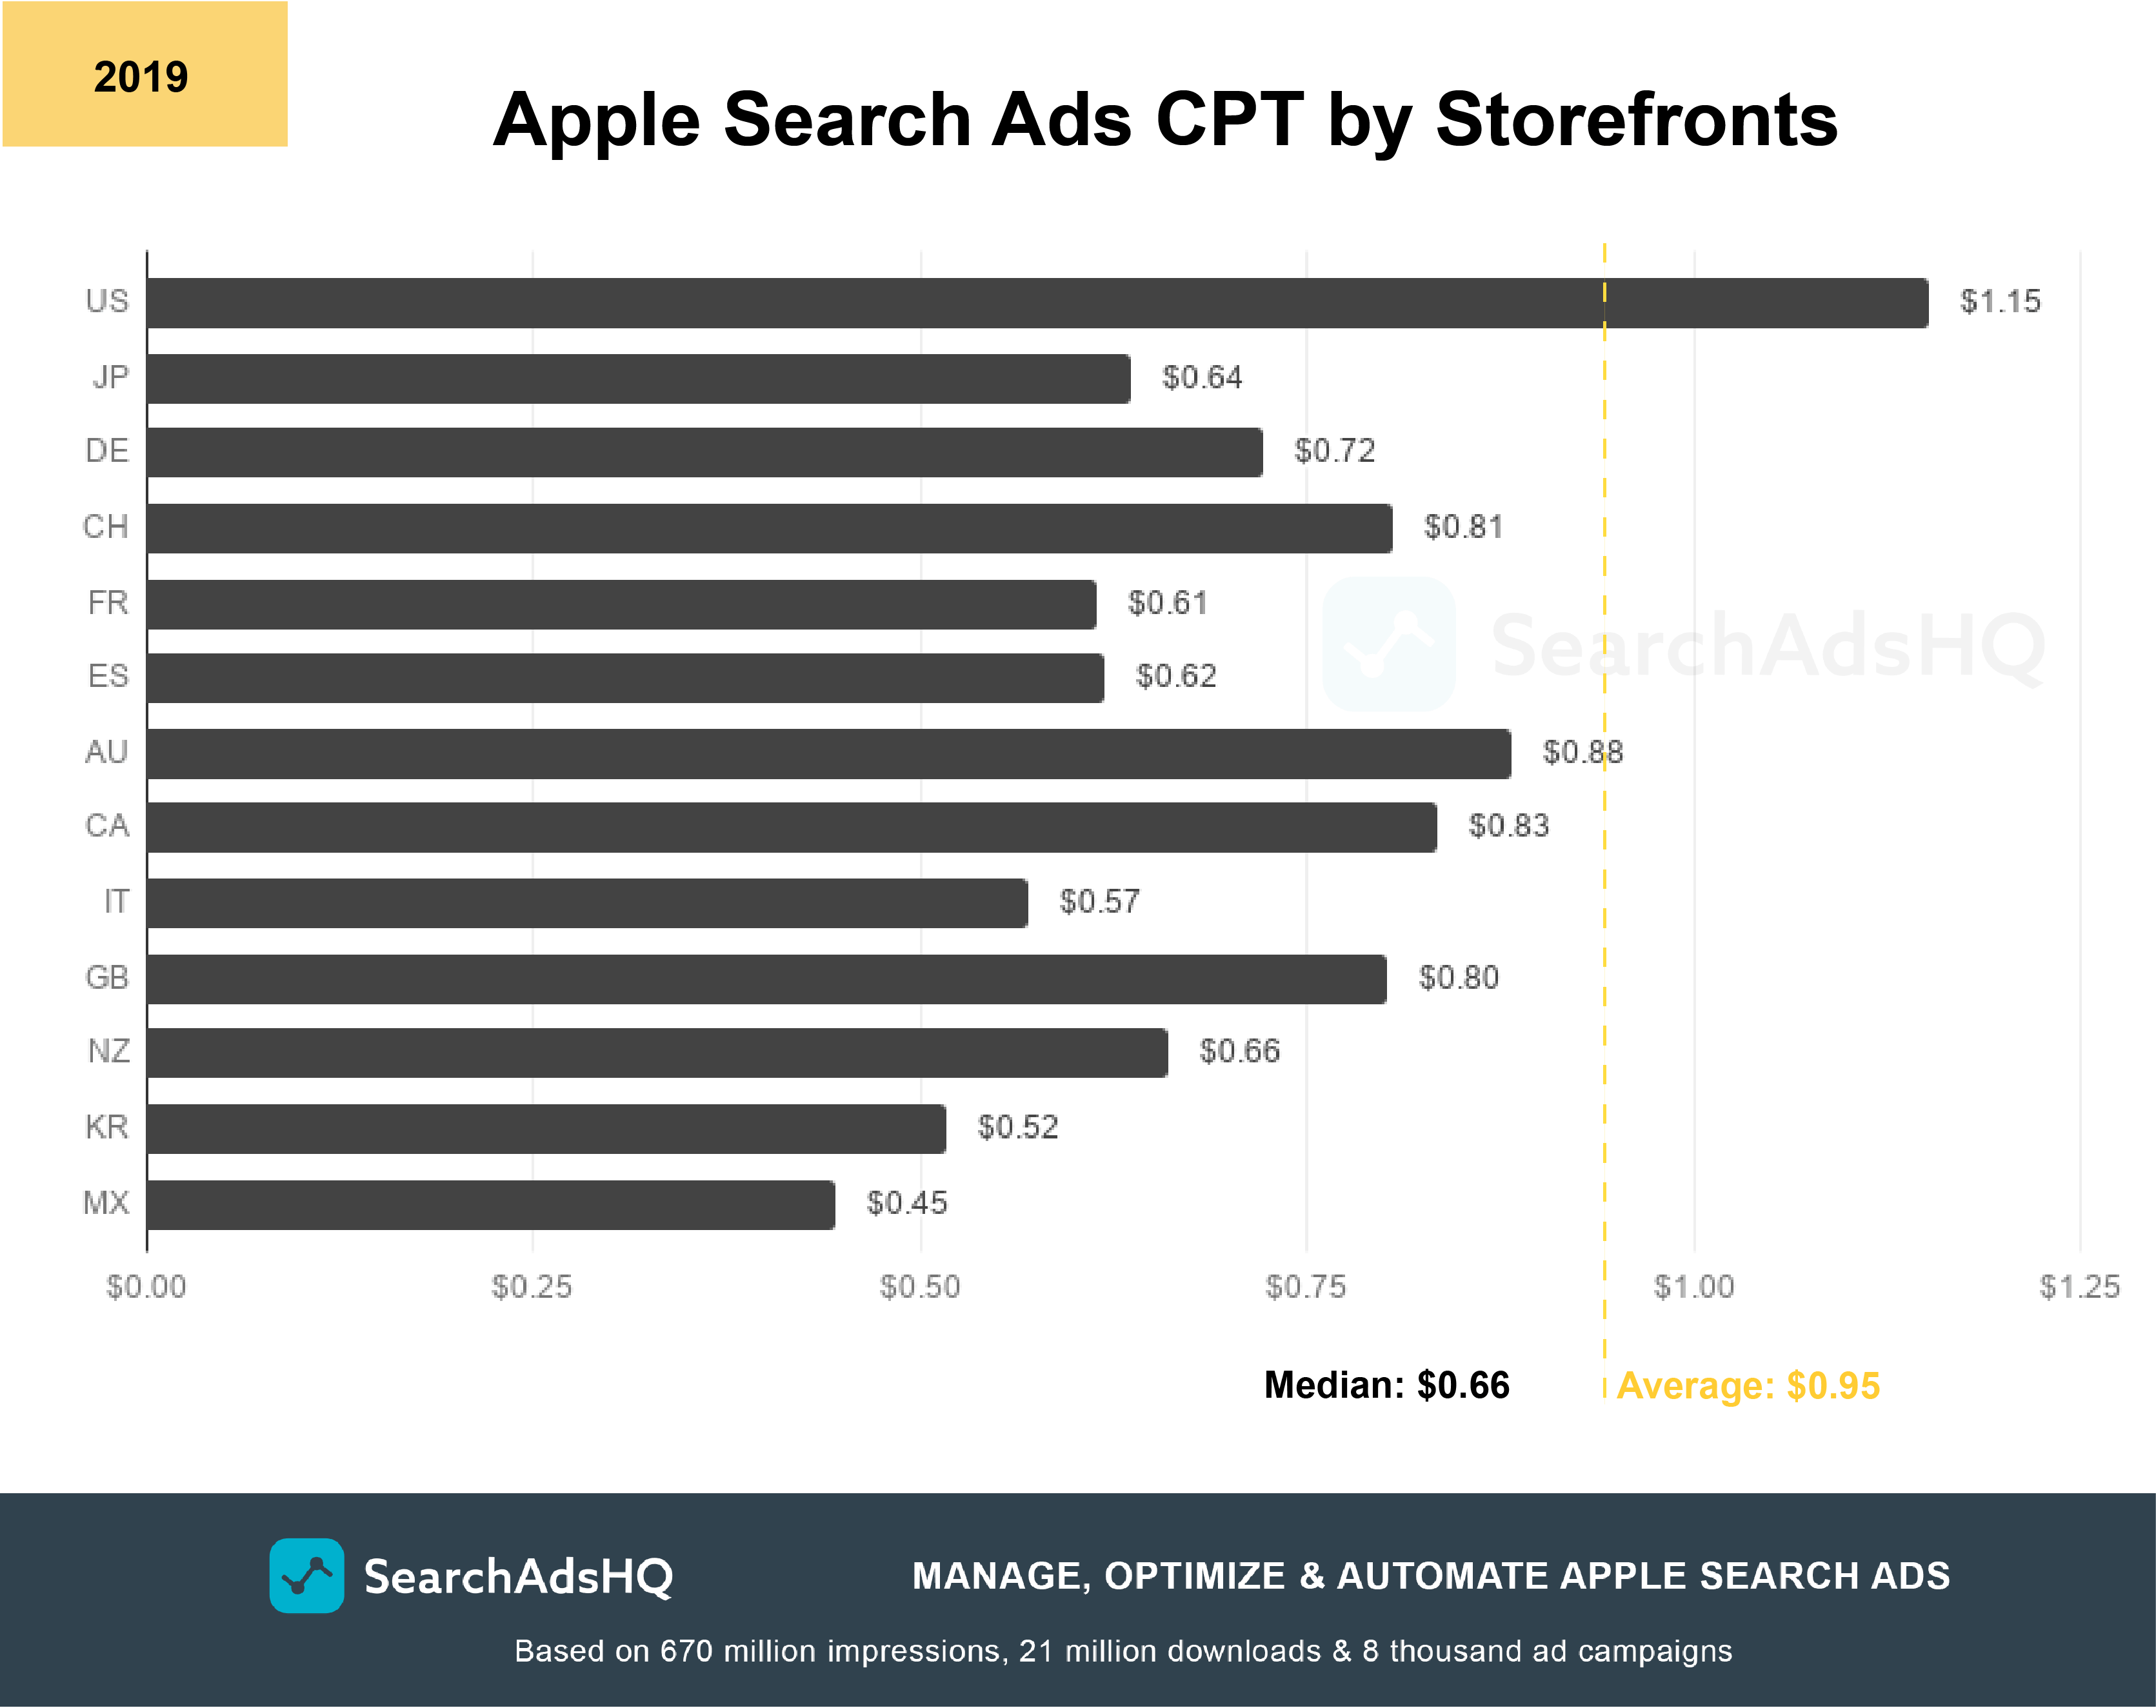
When it comes to Cost-per-tap (CPT), the US storefront appeared to be the most expensive and competitive one. It’s the only location which exceeded the average CPT of approximately $0.95. Australia and Canada are also competitive, with CPTs at $0.88 and $0.83 respectively:
Various storefronts differ in terms of average Costs-per-acquisition. Look at the breakdown of CPAs by locations:
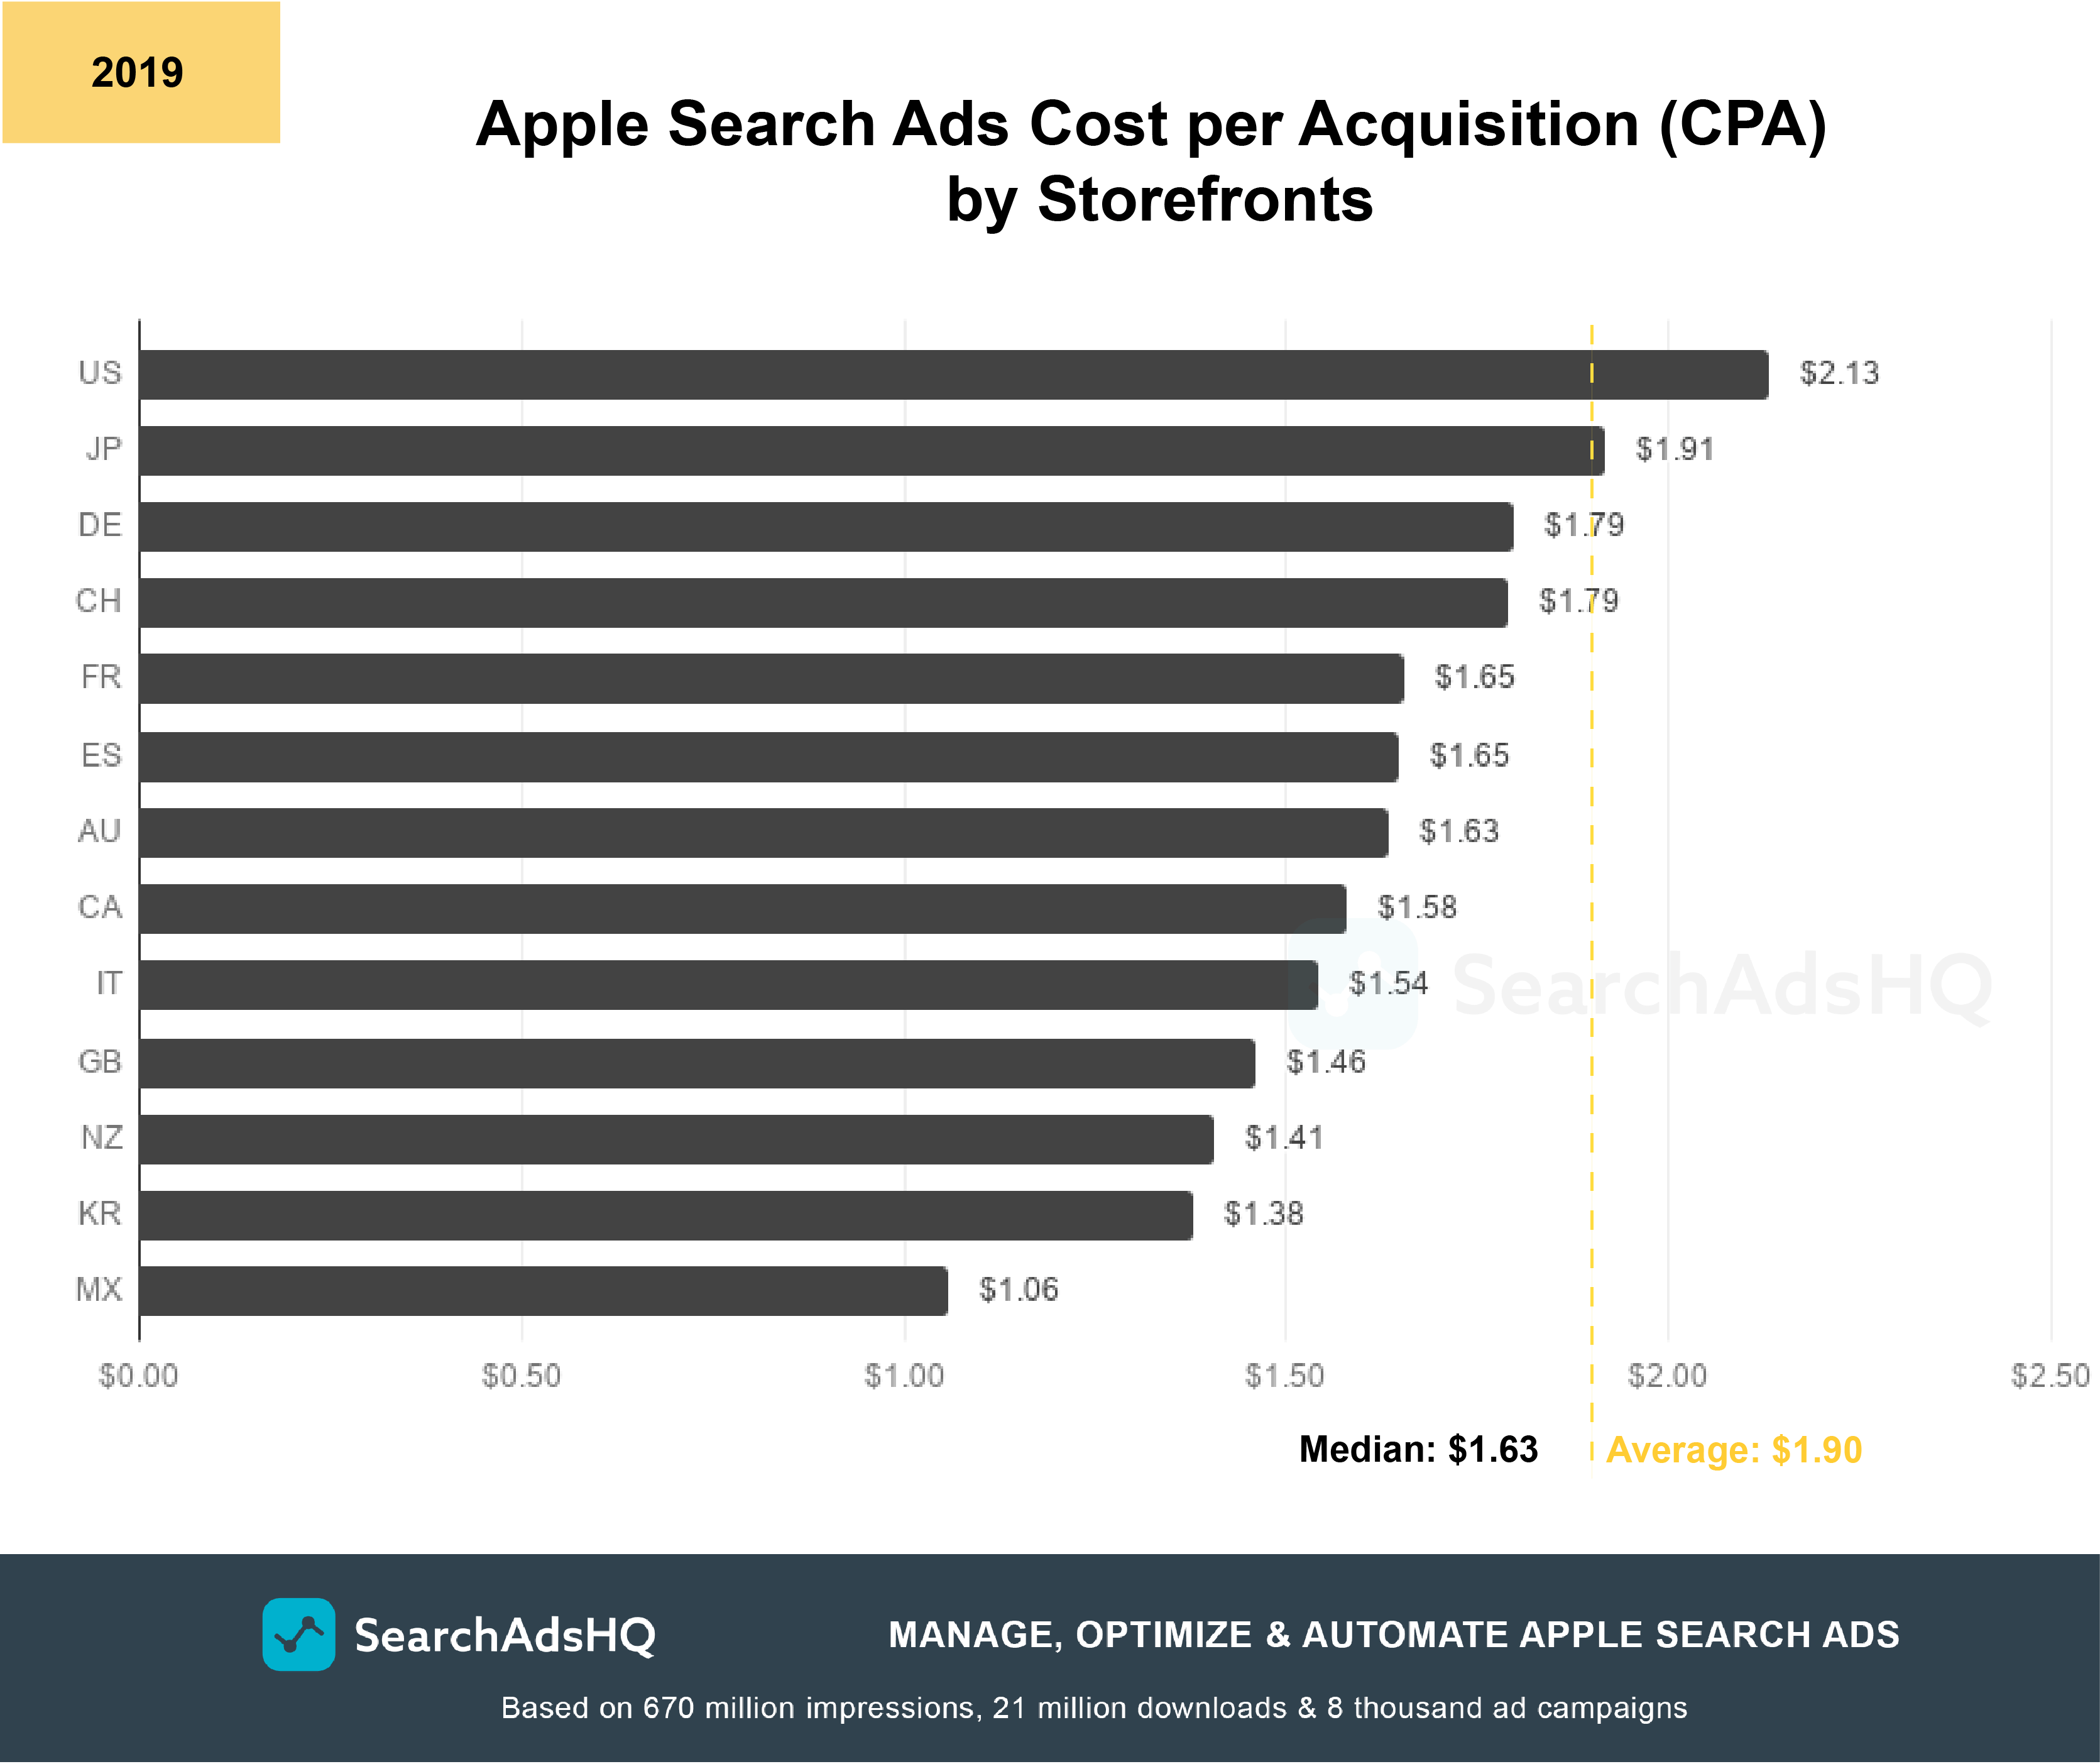
Let’s remind that the average CPA is around $1.90. Again, the US considerably exceeds the average ($2.13), making it the most expensive Apple Search Ads storefront.
Pay attention to the runner up. Japan is the second most expensive storefront after the US, with CPA at $1.91. Low CVR leads to high CPA – this holds true for the Japanese storefront. It’s likely that poor localization lowered the Conversion rate, as well as Tap-through rate, which lead to a high cost per one user attracted.
Leverage SplitMetrics’ Apple Search Ads Benchmark Dashboard to assess the most recent averages – all key metrics at one place, and don’t bother looking for them anywhere else. You have everything to assess your ad performance and improve it if necessary.

SearchAdsHQ is a platform to manage, optimize and automate your Apple Search Ads campaigns. Request a free demo at SplitMetrics Acquire.